Collecting and Interpretation Data

- From a recent census in a particular residential area it was found that
of residents had English as their main language and of the population were under 18 years old. You may assume that these characteristics are independent. The local library wants to explore this issue and decides to create a sample of 200 people.
(a) In a stratified sample, how many of the 200 people should be 18 years old or over and have a main language that is not English?
Hint
Solutions
(b) Describe one difficulty of creating a stratified sample.
Hint
Solutions
Hint
Solutions
- A motoring magazine carried out a survey of the value of petrol-driven cars that were five years old. In the survey, the value of each car was expressed as a percentage of its value when new. The results of the survey are summarised in the following table and histogram.
|
|
|||||
|
|
4 | |||||
|
|
12 | |||||
|
|
18 | |||||
|
|
13 | |||||
|
|
6 | |||||
|
|
5 | |||||
|
|
2 |
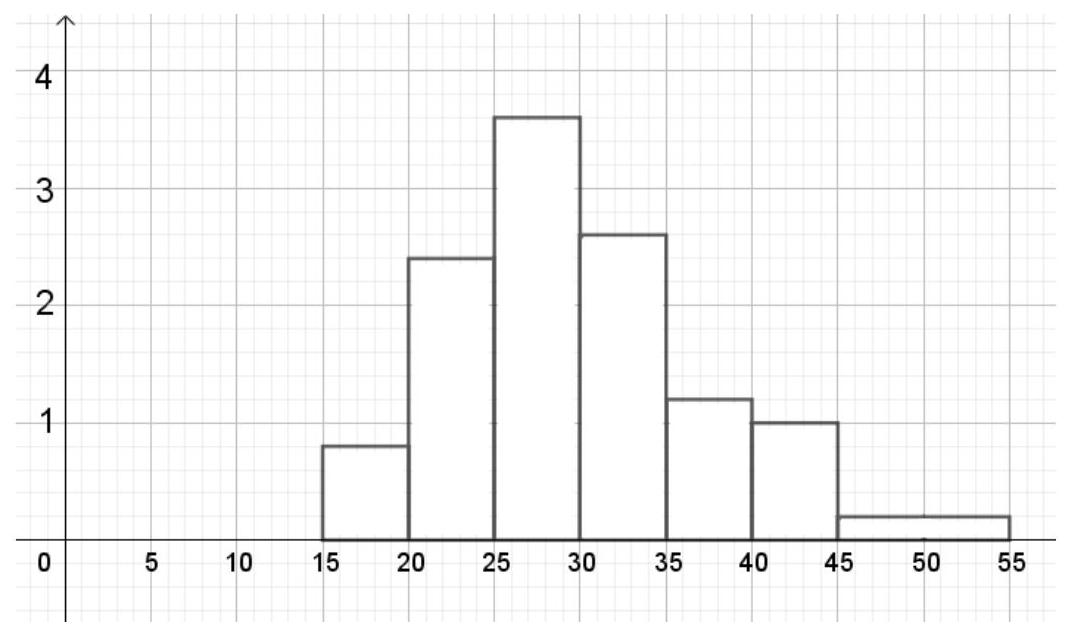
(a) Write down the labels that should appear on the two axes of the histogram.
Hint
Solutions
(b) Calculate estimates of the mean and standard deviation of the data, giving your answers correct to 2 decimal places. Hence identify any outliers, explaining your method.
Hint
Solutions
A similar survey of 60 diesel driven cars produced a mean of
Hint
Solutions
Questions 3 and 4 concern data from the 35 most populous countries in each of Asia and Europe for which data were available.
- Fig 3.1 shows a scatter diagram of life expectancy at birth in
, against life expectancy at birth in , for the 35 countries in Asia, along with the regression line. The correlation coefficient is 0.8457 .
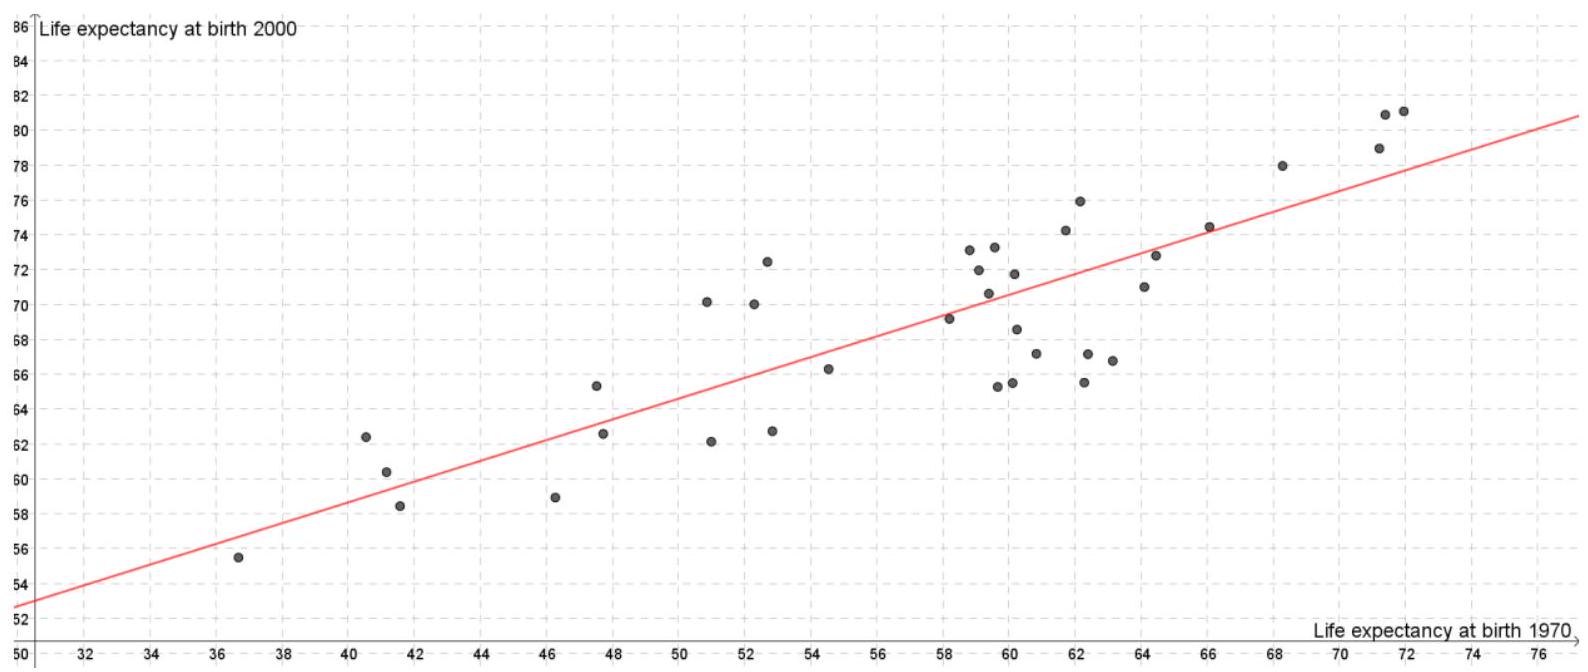
Figure 1: Fig 3.1
(a) Describe the association between life expectancy at birth in 2000 and life expectancy at birth in 1970 for these 35 countries in Asia.
(b) Given that the equation of the regression line is of the form
(b) Given that the equation of the regression line is of the form
Fig 3.2 shows a scatter diagram of life expectancy at birth in
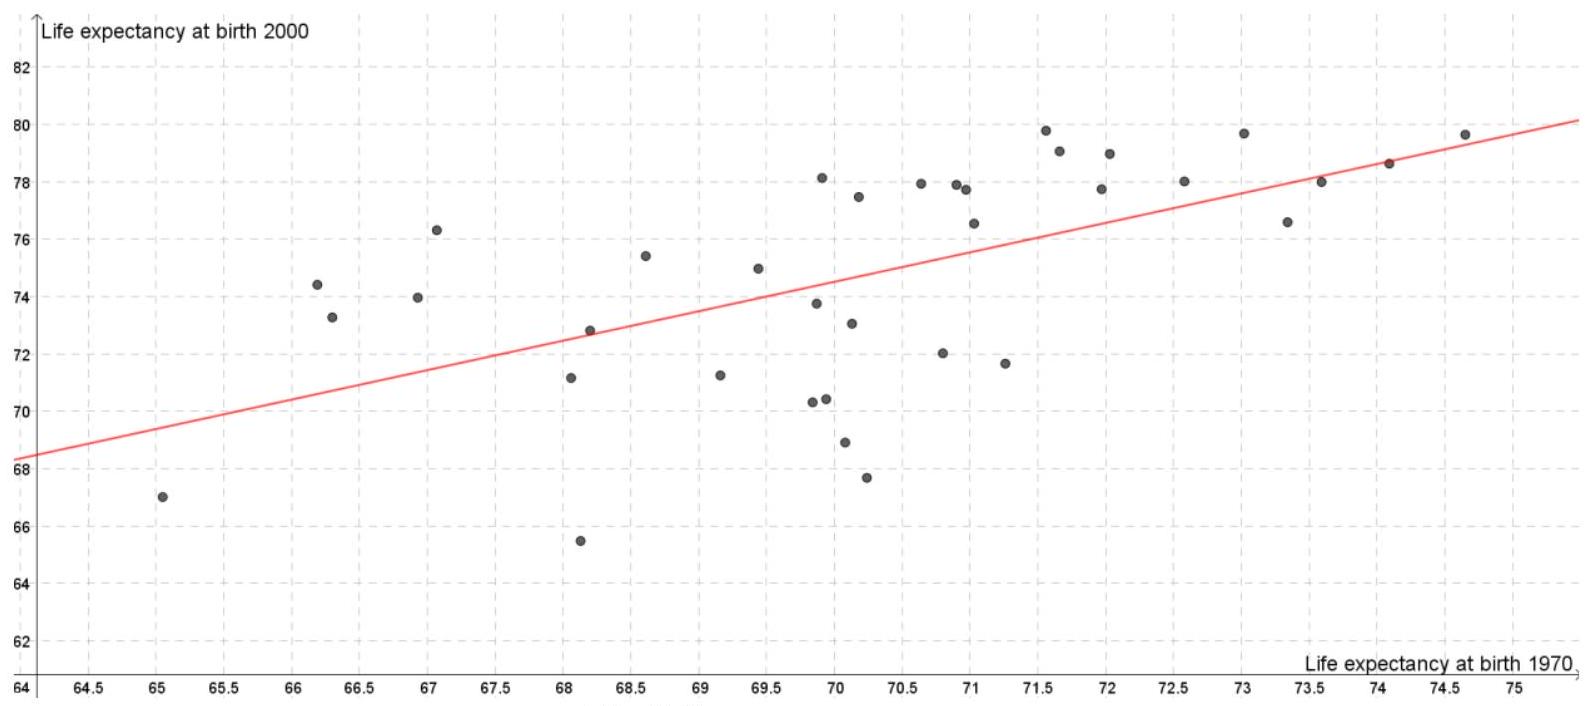
Figure 2: Fig 3.2
(d) Make one other comparison between the two sets of countries based on information in the scatter graphs.
- The stem-and-leaf diagram below shows the most recent data for the median age, in years, of the population in each of the 35 countries in Europe. For example, there is one country in which the median age of the population is 47.4 years.
| low: | 33.4 | ||||||
| 37 | 0 | 1 | 2 | ||||
| 38 | 2 | ||||||
| 39 | 3 | 8 | |||||
| 40 | 3 | 5 | 8 | ||||
| 41 | 0 | 1 | 1 | 5 | 5 | 6 | 9 |
| 42 | 5 | 5 | 5 | 6 | 7 | 7 | |
| 43 | 0 | 0 | 1 | 3 | 7 | 9 | |
| 44 | 0 | 2 | 2 | 9 | |||
| 45 | 8 | ||||||
| 46 | |||||||
| 47 | 4 |
Key: 3|1 means 3.1
(a) Find the values of the median, the lower quartile and the upper quartile for these data.
(b) Any value that is more than 1.5 multiplied by the interquartile range from the nearest quartile can be classed as an outlier. Use this definition of an outlier to show that the only outlier is 33.4 .
(a) Find the values of the median, the lower quartile and the upper quartile for these data.
(b) Any value that is more than 1.5 multiplied by the interquartile range from the nearest quartile can be classed as an outlier. Use this definition of an outlier to show that the only outlier is 33.4 .
Table 4a shows summary statistics for the most recent data for the median age of the population in the 35 countries in Asia. The two countries in Asia with the highest median age are Japan ( 47.7 years) and Hong Kong ( 44.8 years). Two of the statistics are missing.
|
|
35 |
| Mean | |
|
|
|
|
|
1048.3 |
|
|
32942.71 |
| Min | 19 |
| Q1 | 24.5 |
| Median | 29.9 |
| Q3 | 33.1 |
| Max | 47.7 |
Table 1: Table 4a
Fig.
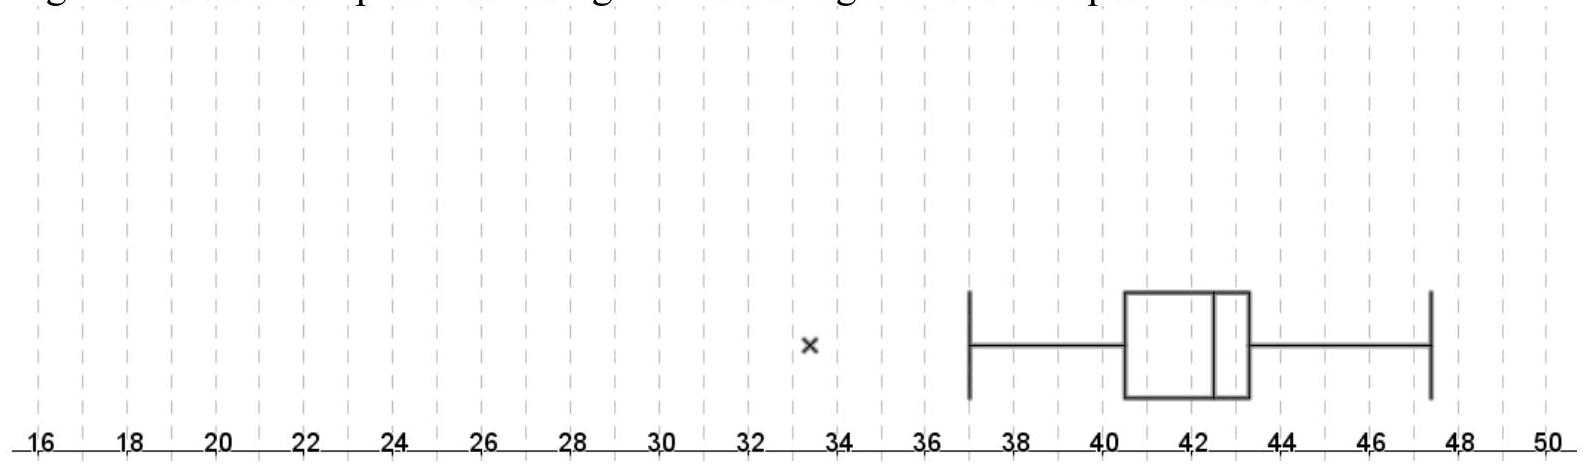
Figure 3: Fig. 4b
(d) On a copy of Fig. 4b, using the information given in Table 4a, draw a box plot for the median age in the Asian countries.
(e) Referring to the two box plots, make two comparisons between the data in the two regions.
(f) Calculate the values of the mean and the standard deviation for the Asian countries.
(g) An alternative definition of an outlier is a value that is more than 2 standard deviations from the mean. Show that this definition also makes Hong Kong an outlier.