Functions

- The functions g and h are defined as follows:
Find the following functions, giving the domain and range of each.
- (a) Sketch the graph of
.
(b) Hence, or otherwise, solve each of the following equations:
(i)
(ii) - The diagram below shows the graph
, where for .
The graph approaches the line
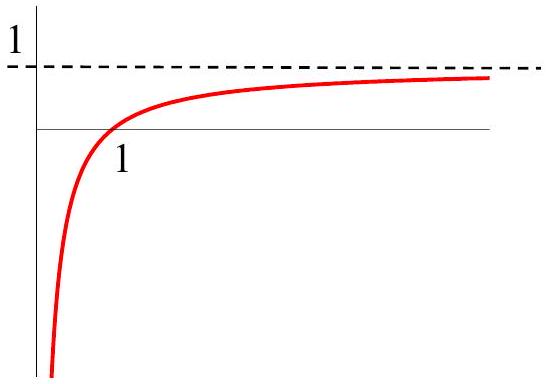
(a) Write down the domain and range of
(b) Find the inverse function
(d) Sketch the graph of
(e) What is the relationship between the graph of
(a) Write down the domain and range of
(b) Find the inverse function
(d) Sketch the graph of
(e) What is the relationship between the graph of
- A biologist observes a population of rabbits regularly over a period of several years. Her observations show that for the first 2 years the population size doubles approximately every six months, from an initial population of 50 rabbits, before levelling off. She suggests the following model for the population in the first 2 years:
where
(a) Give values for
(a) Give values for
The biologist is interested in how much food is required to sustain the rabbit population. She suggests a model of:
where
(b) Explain what the coefficient of
(d) Explain why the given domain for the function is unlikely to be a good model.
(e) Find the composite function
(b) Explain what the coefficient of
(d) Explain why the given domain for the function is unlikely to be a good model.
(e) Find the composite function
Explain what relationship is given by this composite function.
(f) Explain why it does not make sense to find the composite function
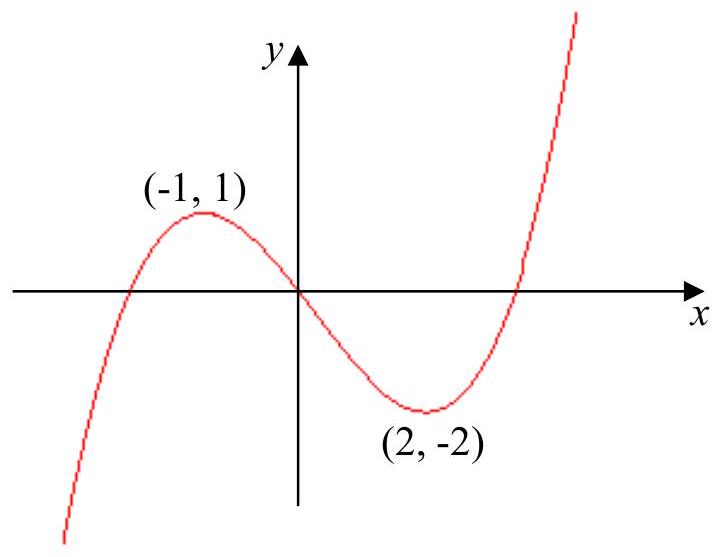
5. The graph of a function
(f) Explain why it does not make sense to find the composite function
5. The graph of a function
Sketch each of the following graphs, giving the coordinates of the turning points in each case.
(a)
(b)
(d)
(a)
(b)
(d)