Statistical Hypothesis Testing

- (a) State what is measured by the product moment correlation coefficient.
Hint
Solutions
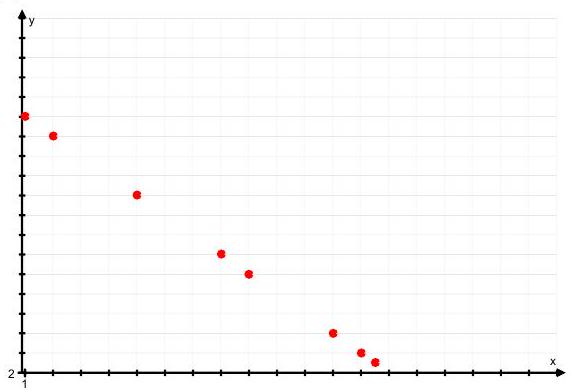
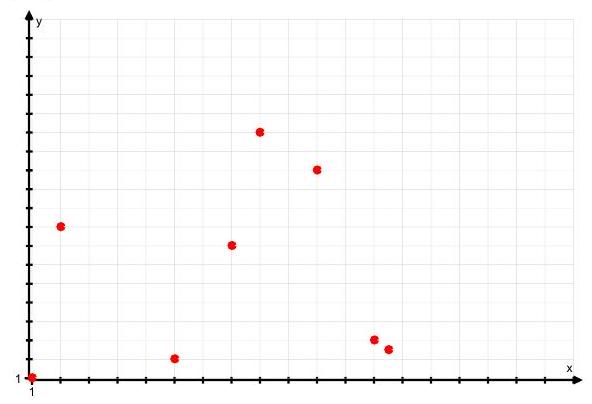
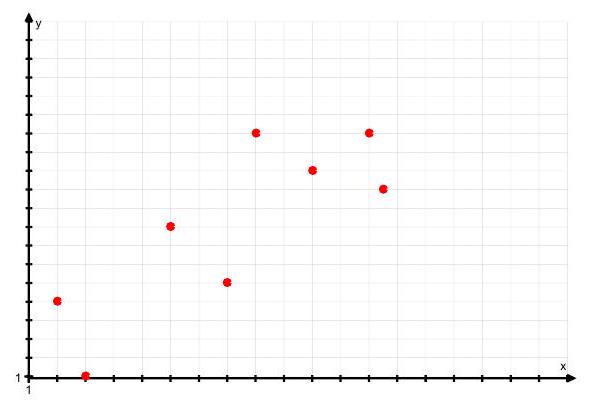
(b) Describe in words the correlation in the following three diagrams, and suggest a value for
(i)
(ii)
(iii)
2. A survey of weather in a tropical region is undertaken and the data analysed. The product moment correlation coefficient between the daily mean temperature and the daily rainfall is calculated as 0.267 with a
3. A sports scientist wishes to test whether those who are good at sprinting are also good at long jump. For a sample of 30 athletes, she records the time,
(a) Write down the null and alternative hypotheses for her test. Explain why the alternative hypothesis takes the form that it does.
(b) The critical value for a one-tailed test with
- The manufacturer claims that packets of pasta have a mass of 500 g . The masses are normally distributed and the standard deviation is known to be 5 g . An inspector wants to find out if the packets are underweight. She weighs 16 packets of cereal and finds that they have a total mass of 7955 g . Carry out a hypothesis test at the
level. - A driver wishes to improve his reaction time, which is a normally distributed random variable with mean 0.34 seconds and standard deviation 0.06 seconds. The driver undertakes a training course. Afterwards, a random sample of 8 reaction times is taken and the times are as follows (in seconds).
Assuming that the underlying standard deviation has not changed, test at the
6. The heights of three year old children are thought to be normally distributed, with a mean of 90 cm and a standard deviation of 5 cm . A scientist wishes to determine whether the mean height has changed, using a sample of 15 children.
(a) Stating your hypotheses clearly, find the critical region for a two-tailed test at the
(b) A random sample of 15 children is taken and the following heights are measured:
| 88 | 94 | 90 | 92 | 91 |
| 89 | 93 | 87 | 95 | 90 |
| 96 | 93 | 89 | 91 | 93 |
Using your answer to (a), decide what conclusion the scientist should draw.