Numerical Methods

- (a) By considering turning points, show that
has only one real root and that this root lies between -2 and -1
Hint
Find the cubic function values at -2 and -1, and identify the “change of sign”, that means at least one root in that interval.
Differentiate the cubic to find its turning points. Then find second derivative to classify the turning points as local maxima or minima. If both local minima and maxima are above or below the x-axis, then there is only one real root between -2 and -1.
Differentiate the cubic to find its turning points. Then find second derivative to classify the turning points as local maxima or minima. If both local minima and maxima are above or below the x-axis, then there is only one real root between -2 and -1.
Solutions
Let
Since
Then do first derivative to find turning points:
so the turning points are
Now calculate the second derivative to find the nature of these turning points (maxima or minima):
hence
Evaluate
Since both the local maximum and local minimum lie above the
Hence the equation
(b) Show that this root is -1.104 , correct to 3 d.p.
Hint
Since the question says the root is -1.104 and asks for 3 decimal places, we can try -1.1045 and -1.1035 to see which side of the root they are on. Then we can keep halving the interval until we reach the desired accuracy.
Solutions
I would try with
Since it asks for 3 decimal places, we can stop here and say the root is
Since it asks for 3 decimal places, we can stop here and say the root is
- (a) Show that the equation
has a real root between and .
Hint
Evaluate the function at the endpoints of the interval and check for a sign change.
Solutions
Consider the function
The function
Since
Hence there is a real root of
(b) Use the iterative formula
Hint
Use “fixed point iteration” method. Start with the initial guess
Solutions
Two iterations of the map
Given
First iteration:
Second iteration (use the value of
Therefore the two further approximations are
Hint
Can try same method as in question 1(b), use “sign of change” method to verify the root is between two values that round to 2.081 when rounded to 3 decimal places.
These two values can be 2.0805 and 2.0815.
These two values can be 2.0805 and 2.0815.
Solutions
Consider the fixed-point iteration
Check if it is correct to 3 decimal places by using “sign of change” method:
Using
Using
Since there is a sign change between
- (a) Show that the gradient of
is always positive and deduce that the equation has one real root only.
Hint
If the derivative (gradient) is always positive, then the function is strictly increasing for all values of x
A strictly increasing continuous function can have at most one real root. Then just need to show a root exists by using “change of sign” method.
When using change of sign method, try evaluating at some special points, like
A strictly increasing continuous function can have at most one real root. Then just need to show a root exists by using “change of sign” method.
When using change of sign method, try evaluating at some special points, like
Solutions
Consider the function
Differentiate with respect to
Since
so
A strictly increasing continuous function can have at most one real root. To show a root exists, evaluate at two points:
By the Intermediate Value Theorem there is some
has exactly one real root (located in the interval
(b) Show that this root lies between
Hint
sometimes the hint is on the question itself 😃 This question b is hint for question a when doing “sign of change”.
Solutions
Let
Since
Hint
Start from the equation
Solutions
Start from the equation
Bring the constant to the right-hand side:
Factor out
Divide both sides by
(d) Using the iterative formula
Hint
Using the formula from question ©, substitute
Solutions
Using the iteration
and starting with
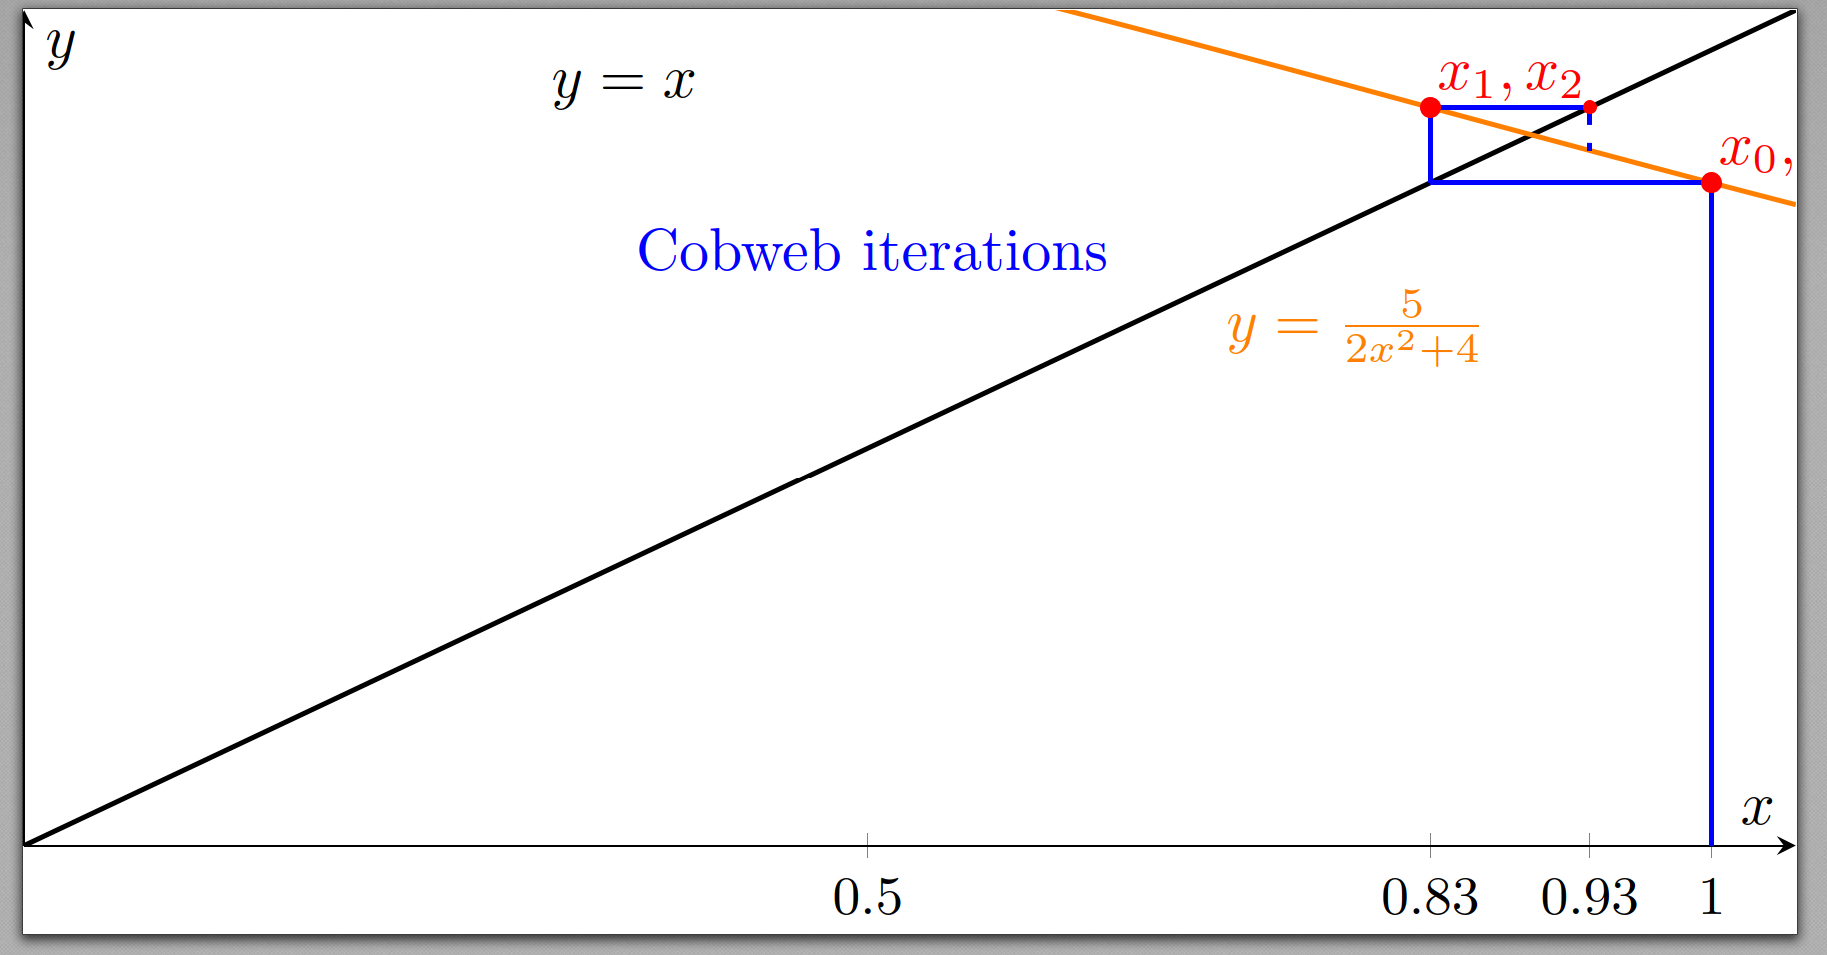
(e) The diagram below shows part of the graphs of
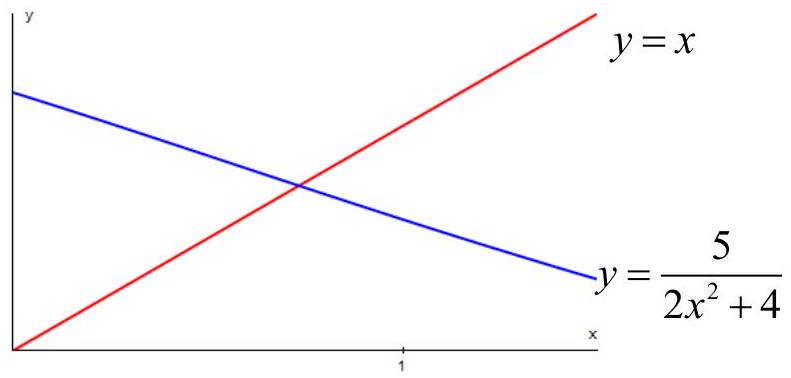
Copy the diagram and draw on it a staircase or cobweb diagram to illustrate how the iterations converge to the root. Indicate the positions of
Hint
Draw the CobWeb diagram step by step:
- Start at the point
on the x-axis. - Then draw
and using the iterative formula.
Solutions
(f) Show that the root is 0.893 correct to 3 decimal places.
Hint
Same as previous “sign of change” method, try evaluating at two values that round to 0.893 when rounded to 3 decimal places, e.g. 0.8925 and 0.8935.
Solutions
Consider the function
Since there is a sign change between
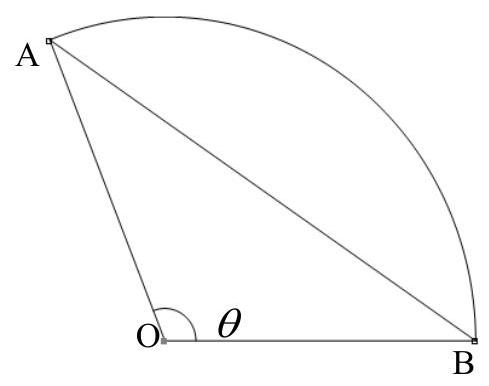
- A sector AOB of a circle with radius 10 cm and centre O has an angle AOB of
radians.
The chord AB divides the sector into two regions of equal area.
(a) Show thatsatisfies the equation .
Hint
The area of the sector AOB is given by
Solutions
The area of sector AOB is given by
The area of triangle AOB can be calculated using the formula
Since the chord AB divides the sector into two regions of equal area, we have
Substituting the expressions for the areas, we get
Simplifying this equation gives
Rearranging, we obtain the required equation:
(b) Use 3 iterations of the Newton-Raphson method, starting from
Hint
calculate the derivative of the function
Perform 3 iterations starting from
Solutions
We want to solve the equation
The Newton-Raphson iteration formula is given by
Starting with an initial guess of
1st iteration:
1st iteration:
2nd iteration:
3rd iteration:
After 3 iterations, we find that
- The diagram shows a cross-section of a tunnel. The height is measured in metres every 0.5 metres along the cross section.
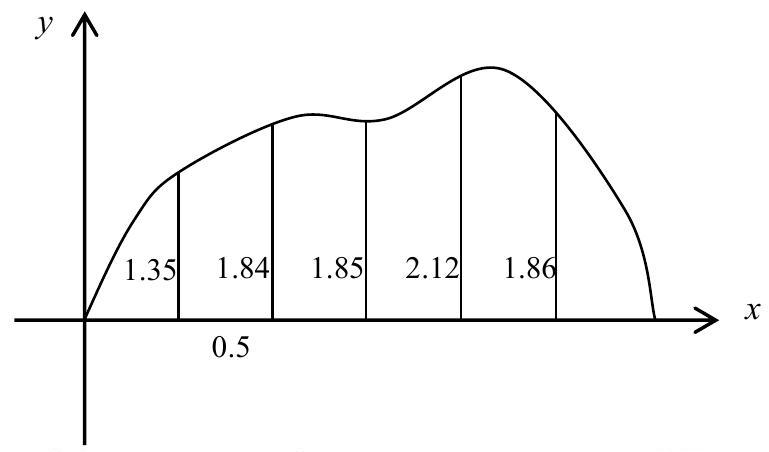
(a) Use the trapezium rule to estimate the area of the cross-section.
Hint
The trapezium rule formula is given by:
where
Solutions
Using the trapezium rule, we can estimate the area of the cross-section of the tunnel. The heights at each measurement point are as follows:
The width of each interval is
Substituting the values, we get:
Calculating the sum inside the parentheses:
Now substituting back into the area formula:
(b) Is it an under-estimate or over-estimate?
Hint
Check if the curve has points of inflection. If it is always concave up, the trapezium rule gives an underestimate; if always concave down, it gives an overestimate. But if there are points of inflection, we cannot usually tell.
Solutions
Since there is a point of inflection in the curve, the curve changes between concave up and concave down, we cannot usually tell if it is an over-estimate or under-estimate just by looking at the graph.
- An estimate is required for the integral
.
Using 5 rectangles, find overestimates and underestimates for the value of the integral.
Hint
Firstly, decide whether the function \(f(x) = x \sqrt{x^3 + 1}\) is increasing or decreasing on the interval \([0, 1]\). Then, for the overestimate using right endpoints, divide the interval into 5 equal subintervals and calculate the function values at the right endpoints. For the underestimate using left endpoints, use the left endpoints of the same subintervals.
Solutions
The function
To find the overestimate using right endpoints, we divide the interval
Calculating the function values at these points:
To find the overestimate using right endpoints, we divide the interval
Calculating the function values at these points:
The overestimate is given by:
To find the underestimate using left endpoints, we use the left endpoints
Calculating the function values at these points:
Calculating the function values at these points:
The underestimate is given by: